Cyber Shujaa Exploratory Data Analysis Assignment
From Blueprints to Binaries: An Architectural Approach to Titanic EDA 🏛️ ➡️ 💻
In architecture, the integrity of a structure depends on the site investigation conducted before the first stone is laid. In Data Science, that investigation is Exploratory Data Analysis (EDA).
As an architect pivoting into AI, I have applied this structural mindset to my latest project: a deep dive into the Titanic dataset as part of the Cyber Shujaa Data and AI Specialist track.
The Project Foundation 📐
The primary goal of this assignment was to develop hands-on experience with the standard EDA workflow. Using a dataset of 891 passengers from the Pandas documentation, I explored 12 initial features to understand what factors influenced survival.
The Toolkit 🛠️
- Language: Python.
- Libraries: Pandas, Numpy, Matplotlib and the Math module.
- Environment: Jupyter Notebook and VS Code.
Building the Model: Data Cleaning & Feature Engineering 🏗️
Just as we categorize building materials by their properties, I refined the raw data to make it “load-bearing” for analysis.
- Handling Missing Values: Addressed gaps in the
Cabin,AgeandEmbarkedcolumns. - Data Typing: Converted
Survived,Pclass,SexandEmbarkedinto categorical data types for better processing. - Efficient Replacement: Utilized
np.where()to replace values, realizing that Numpy is essential for simplifying the EDA process. - Feature Engineering: Created three new features ⎯
Age Group,AccompaniedandCabin Assignment⎯ bringing the total to 15 features. - Categorical Mapping: Transformed discrete age values into specific age group categories.
Visualizing the Structure 📊
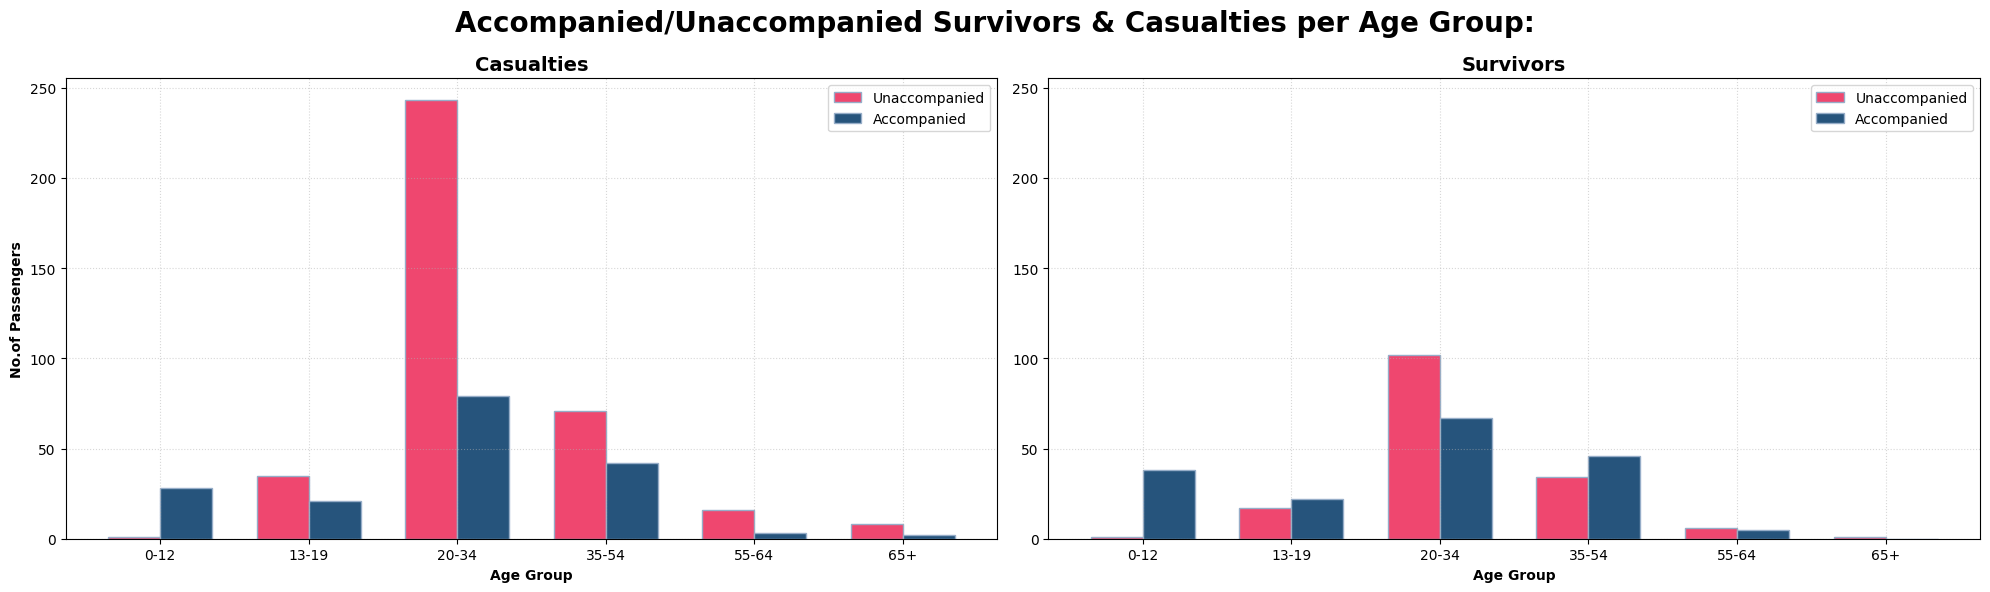
One of my biggest “aha!” moments involved Matplotlib. I learned that it requires data in an array-like structure to plot effectively. This understanding allowed me to create a multivariate analysis of survivors and casualties based on whether they were travelling “accompanied”.
Structural Insights 💡
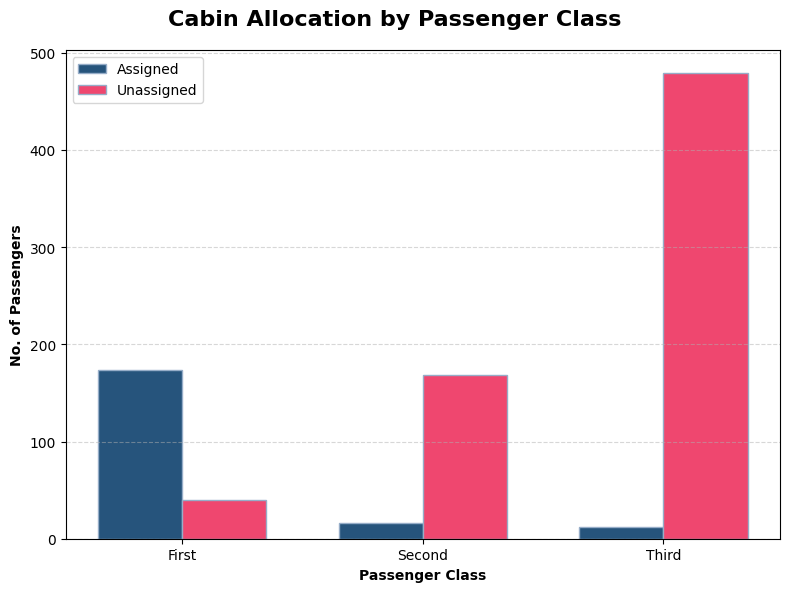
- Class Disparity: Cabin allocation was tied directly to passenger class; First Class had the highest number of allocations, while Third Class had the lowest.
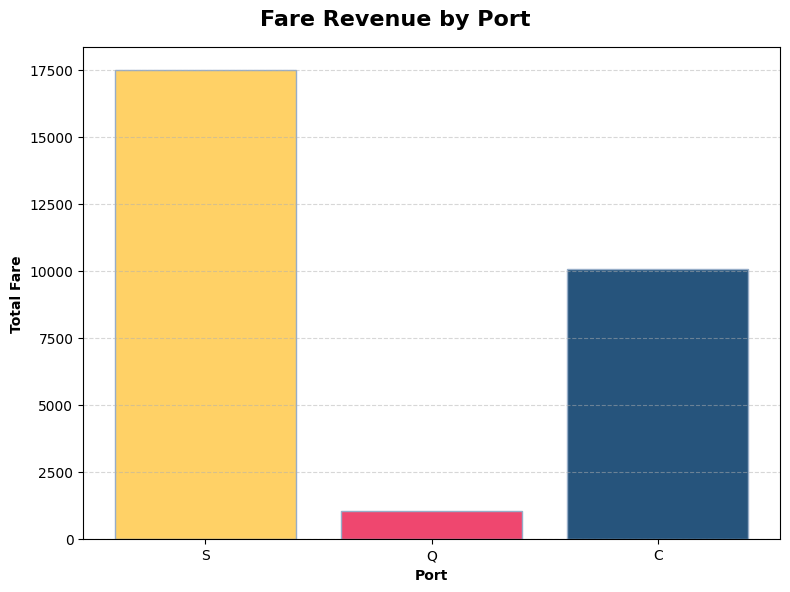
Port Statistics:
- Port S recorded the highest fare revenue, while Port Q recorded the lowest.
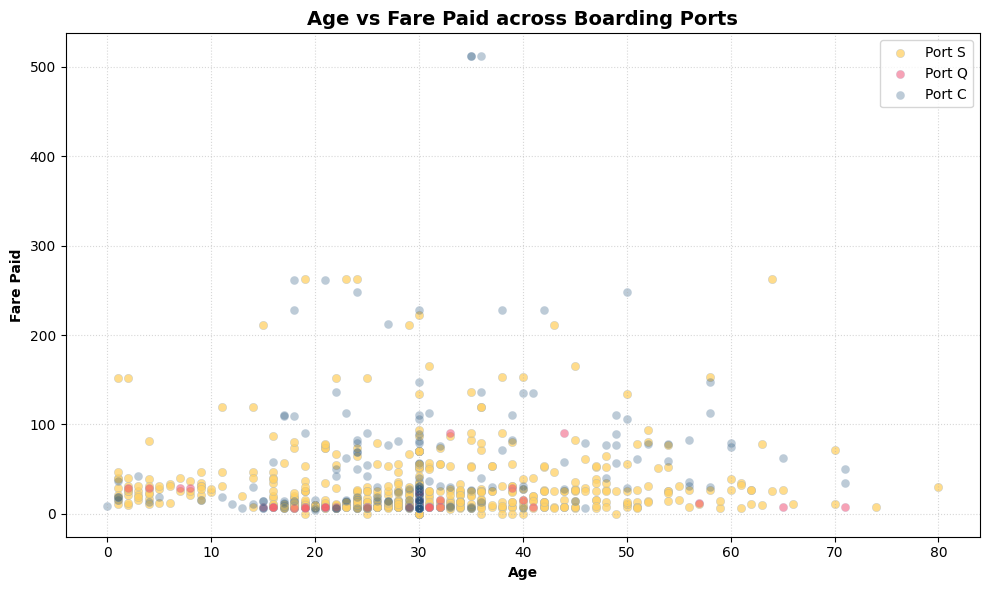
- Port S recorded the lowest fares while Port C the highest.
- Survival Rates: Unfortunately, the total number of casualties was higher than the number of survivors.

The Roadmap Ahead 🚀
While I have successfully mastered changing column data types and basic plotting, my journey is just beginning:
- Next Steps: I plan to conduct a more concise analysis of the
Survivedtarget variable. - Learning Goals: I am diving deeper into Numpy, exploring advanced Matplotlib customization and studying Data Structures as they apply to Pandas.
I am aiming to secure my first role in Data Science and AI by June this year, bringing a unique blend of analytical and design-oriented skills to the table.